Stability Testing
Reading an Instability Instead of Guessing
The useful work starts after something breaks. What broke, under which load, at what temperature, and what changed just before it.
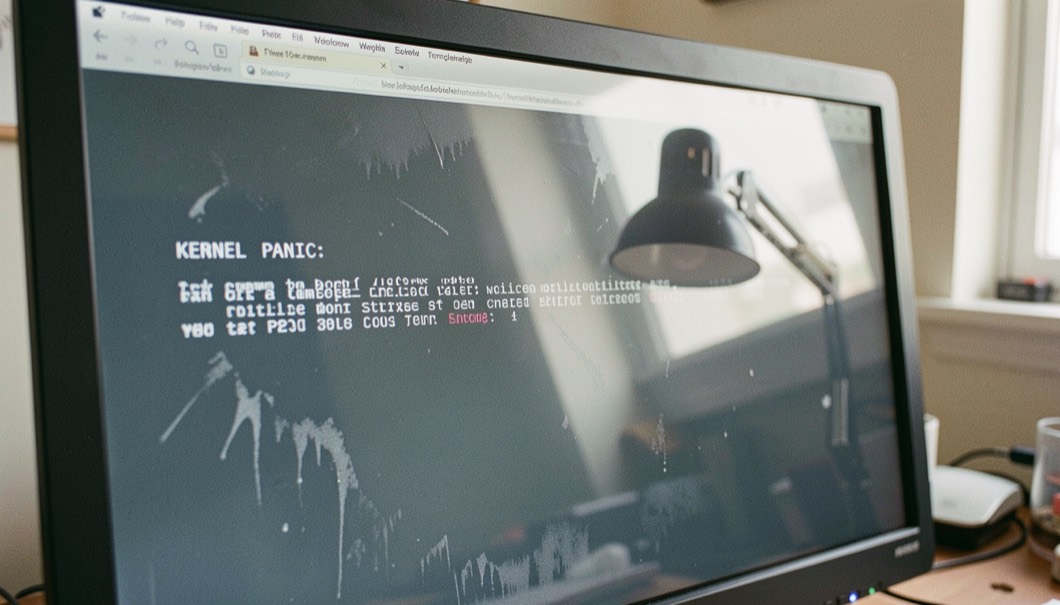
A crash, a freeze, and a silent wrong answer introduce themselves as three different faults. They are often one fault in three costumes, and only the first costume leaves a note. This page describes reading that note instead of swapping parts against a guess.
The note is real because the kernel writes it. A kernel that hits a fault prints a stack dump: banners, addresses, a list of loaded modules, a chain of function names. The kernel's documentation treats that block as the starting material of diagnosis, and its bug hunting chapter opens with a sample because reports, in that chapter's own experience, arrive carrying one.
The note a crash leaves behind
The chapter's first sample is a warning rather than a collapse. A banner line names a file and a function directly, kernel/module.c at line 1108, inside module_put. Under it sit the processor number, a process id, the command that was running at that moment, here rmmod, a field of taint letters, the modules linked in, and the call trace, each frame written as a symbol with an offset. The chapter's claim about that block is plain: it carries enough information to identify the line in the kernel source where the bug happened.
Severity changes the banner, not the method. The second sample is the harder kind, "BUG: unable to handle kernel NULL pointer dereference", followed by an "Oops: 0002" line. The chapter then says it will use the word Oops as shorthand for every kind of stack trace that needs analysis, and this page borrows that convention: an Oops is any text the kernel printed on its way down. The chapter also states one condition on quality: if the kernel was built with CONFIG_DEBUG_INFO, the script scripts/decode_stacktrace.sh enhances the trace. A kernel built without that option still prints, in raw addresses.
What do the module marks mean?
The line labeled Modules linked in is a sentence about what the kernel was carrying. A module marked with a plus was being loaded. A module marked with a minus was being unloaded; in the chapter's sample, the module at the front of the trace, dvb_usb_gp8psk, carries one. A module wrapped in parentheses is tainted, and the letters inside those parentheses, like the PO on the sample's graphics driver, are flags decoded on a separate page of the documentation, Tainted kernels. The header field of the same sample, Tainted: P WC O, uses the same flag alphabet.
Reading that sentence first separates two situations. A trace from an untainted kernel points at the kernel's own source. A trace carrying taint flags points at those flags first, because the documentation maintains an entire page to explain what the letters change about what a report is worth. That page does not publish its meanings inline in the bug hunting chapter, and neither does this one.
Where does the message survive?
An Oops that flashed past on the console is not necessarily gone. Normally, explains the kernel's bug hunting chapter, klogd reads the text from the kernel buffers and hands it to syslogd, which writes it to a syslog file, typically /var/log/messages, depending on /etc/syslog.conf. On machines running systemd, journald may hold it instead, and journalctl reads it back. When klogd itself dies, dmesg redirected to a file pulls the text straight from the buffers. The /proc/kmsg path also exists, with a property the chapter states without apology: it is a "never ending file", and you have to break in to stop the transfer.
When the machine will not take commands
The chapter then addresses the case that closes the easy options: a crash so bad that no command can be entered, or the disk is not available. It lists three routes to the text, compared below.
| Route | What it demands | What it preserves |
|---|---|---|
| Hand copy or camera | Nothing prepared beforehand | Whatever stayed visible on the screen |
| Serial console | A second machine, a null modem, a terminal program | The output captured live on the other machine |
| Kdump | Arrangements made before the crash | The kernel ring buffer pulled from old memory |
The transcription route is copying the text by hand after restarting, or photographing the screen, which the chapter calls not nice but better than nothing. If messages scroll off the top of the console, booting with a higher resolution, for which the chapter suggests vga=791, may let more text be read, with the caveat stated in the same breath: it needs vesafb and will not help for early oopses. The serial route runs a console over a null modem to a second machine and captures there; the chapter names Minicom as one program that works well. The third route, Kdump, comes with a gdbmacro kept in the kernel's own documentation files for extracting the ring buffer from old memory.
The freeze that leaves nothing to read
A crash with text is the cooperative failure. A freeze prints no banner, and a silent wrong answer prints less than no banner. Those two are why people guess, and a completed run of what a stress test proves only ever describes the run that completed, so the reach of each test matters more than its verdict. When suspicion moves from the kernel to a component, a clean memory pass covers less than most people assume.
Between the trace and the blank screen sits the rest of the kernel's own table of contents. Its administration guide keeps bug hunting beside pages on reporting regressions, verifying bugs, and bisecting a regression, which is the documentation treating a single trace as the start of a narrowing process rather than the end of one. And when the machine is too far gone to boot its own disk, a live system keeps the remaining routes open, because the routes that hold data from a dead machine lean on something outside it: a second computer on the cable, or memory preserved for extraction.
Before the next crash
- Know where your syslog file lives, typically /var/log/messages, and check that you can read it.
- On a systemd machine, confirm that journalctl reaches the journald store.
- Decide now which dead machine route is realistic here: a second machine and a null modem, or Kdump set up ahead of time.
- Check whether the running kernel was built with CONFIG_DEBUG_INFO, and keep the matching kernel tree within reach for scripts/decode_stacktrace.sh.
- Keep the Tainted kernels page close, so the letters in the next report can be decoded instead of shrugged at.
Where this goes wrong
The hand copy is the route most people take by default, and it is the one the chapter itself calls messy. A transcribed address with one wrong character still identifies a line, just not the line the kernel meant, and the method fails without an error message of its own.
The screen is also smaller than the trace. Counting on what stayed visible ignores the chapter's own warning that messages scroll off the top of the console, and the higher resolution fix it suggests does nothing for early oopses because it needs vesafb. What scrolled away is gone unless a capture route was already in place.
The gesture that pays for this page is small. The next time a wall of hex prints and the machine still takes commands, stop: do not restart past it. Pull the buffer with dmesg redirected to a file, or read it from the journal, and only then reboot. The kernel wrote the note once, and reading it costs a minute. Swapping the wrong part costs the whole diagnosis.
docs.kernel.org
The documentation site of the Linux kernel itself. Its administration guide holds the pages on tracking down problems: bug hunting, tainted kernels, reporting and bisecting regressions, the Ramoops and pstore oops/panic loggers, kdump, and the magic SysRq keys, alongside guides on booting and building. The quotations and capture routes on this page come from its bug hunting chapter.