Diagnostics
Choosing Satellite Imagery of Asia, and the Machine Behind
Choosing imagery for a project in Asia starts with the question the map has to answer, not with the sensor: pick the spatial resolution, revisit interval, and licence that match the smallest feature you must resolve and how often it changes.
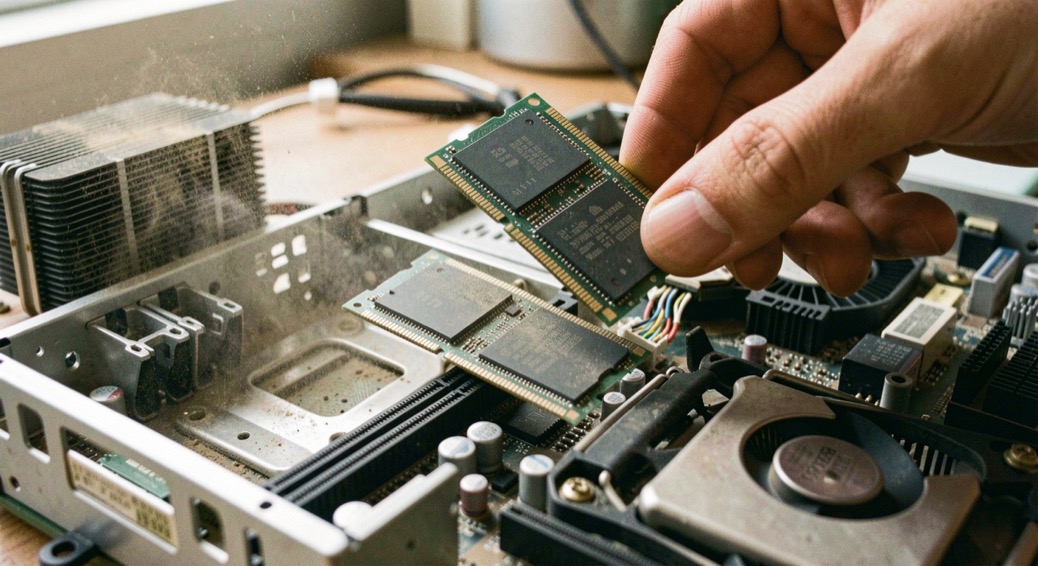
Choosing imagery for a project in Asia starts with the question the map has to answer, not with the sensor: pick the spatial resolution, revisit interval, and licence that match the smallest feature you must resolve and how often it changes. Free optical data from Landsat and Sentinel-2 covers the continent at 10 to 30 m, national missions add finer or more frequent coverage, and the archive you assemble will be limited less by download speed than by the storage, memory, and processing time of the machine that holds it.
How do I choose satellite imagery for a project in Asia?
Work backwards from the deliverable. A flood extent map for a monsoon basin needs revisit more than sharpness: Sentinel-1 radar sees through cloud, which optical sensors cannot do during June to September over South and Southeast Asia. A rice-area estimate needs a consistent time series across one growing season, so a single scene is useless and a monthly composite is not enough. A megacity heat-island study needs thermal bands and a resolution fine enough to separate built-up blocks from parkland, which pushes toward Landsat's 100 m thermal product or a national high-resolution mission.
Three parameters decide most of it. Spatial resolution sets the smallest object you can map, roughly two to three times the pixel size in practice. Revisit time sets how fast you can detect change; Landsat is 16 days per satellite, Sentinel-2 is 5 days with both units, and geostationary Himawari returns a full disk every 10 minutes for weather-scale work. Licence sets what you may publish: Landsat and Sentinel data are open, while some national products carry registration or redistribution terms that need reading before a map goes public.
Cloud cover is the fourth parameter and the one that ruins schedules. Over the Maritime Continent, a usable optical scene may appear only a handful of times per year, which is why radar and optical are usually combined rather than chosen between. Anyone weighing these trade-offs against the practicalities of choosing satellite data for Asia will find the sensor comparison and licence questions treated at length, alongside the regional applications that show what each choice costs in practice.
Where can I download free satellite images of Asia?
Four sources cover most free needs. The USGS EarthExplorer portal serves the full Landsat archive back to 1972 and distributes it at no cost. The Copernicus Data Space Ecosystem serves Sentinel-1, Sentinel-2, and Sentinel-3 products under an open licence. NASA's Earthdata holdings add MODIS and VIIRS, which are coarse but daily and useful for regional composites. JAXA distributes ALOS and Himawari products, the latter at 10-minute intervals for the Asia-Pacific disk.
National portals fill the gaps. India's Bhuvan serves Resourcesat and Cartosat products; Japan's G-Portal covers ALOS; South Korea's KOMPSAT archive is distributed through the Korea Aerospace Research Institute; Thailand's GISTDA runs its own portal for THEOS data. Registration requirements differ, and some products are restricted to research use, so the licence field is worth reading before a dataset enters a project.
Volume is the practical constraint. A single Sentinel-2 tile is roughly 1 GB compressed; a multi-year, multi-tile stack for one river basin can reach several terabytes once unpacked. Plan the download as a batch job with checksums, not as a series of manual clicks, and store the raw archive separately from derived products so a reprocessing run does not mean re-downloading.
| Archive | What it serves | Terms |
|---|---|---|
| USGS EarthExplorer | The full Landsat archive back to 1972 | Distributed at no cost |
| Copernicus Data Space Ecosystem | Sentinel-1, Sentinel-2 and Sentinel-3 products | Open licence |
| NASA Earthdata | MODIS and VIIRS | Coarse but daily, useful for regional composites |
| JAXA | ALOS and Himawari products | Himawari returns a full disk every 10 minutes |
| Bhuvan (India) | Resourcesat and Cartosat products | Registration requirements differ |
| GISTDA (Thailand) | THEOS data | Some products are restricted to research use |
Which Asian countries fly their own Earth observation satellites?
Japan operates the longest-running national program in the region: ALOS-2 carries L-band radar, and the Himawari series provides geostationary weather imaging. India runs one of the largest fleets, with Resourcesat for land, Cartosat for high-resolution stereo, and Oceansat for ocean color. China operates the Gaofen series under its high-resolution Earth observation program, alongside the Fengyun meteorological satellites. South Korea flies KOMPSAT, including radar and optical units. Thailand operates THEOS, its first national observation satellite.
Smaller programs exist across the region, often as single satellites or as instruments hosted on foreign platforms, and several countries participate through regional bodies rather than owning a full ground segment. The practical consequence for a project is that national data may be finer or more frequently tasked than open global products, but access is usually mediated by an agency agreement, a research proposal, or a national portal with its own account system.
What does sustained work on large image datasets ask of the machine?
Storage is the first wall. Raw archives, intermediate stacks, and derived rasters should live on separate volumes; a working rule is to budget three to four times the raw volume for the full processing chain. Spinning disks are adequate for cold archive, but any operation that reads thousands of small tiles benefits from solid-state storage, because the bottleneck becomes random reads rather than bandwidth.
Memory decides whether a job runs or swaps. A single Sentinel-2 band at full resolution for one tile fits comfortably in a few gigabytes; a mosaic of a dozen tiles with masks and indices does not. Sixteen gigabytes is a floor for light work, 32 GB is comfortable for regional mosaics, and 64 GB or more is warranted when classification or machine learning enters the pipeline. Google Earth Engine moves much of this load to remote infrastructure, which changes the local requirement from memory to network stability.
CPU and GPU matter differently. Atmospheric correction, reprojection, and mosaicking are parallel across tiles and scale with core count. Classification and segmentation on image chips scale with GPU memory, and a mid-range card with 8 to 12 GB is often enough for patch-based work. Neither is worth upgrading before storage and memory are adequate, because a fast processor waiting on disk finishes no sooner.
Thermals and power deserve a mention because long jobs expose them. A mosaic that runs for six hours will push a laptop into thermal throttling within the first hour, and the resulting slowdown is easy to mistake for a software problem. Desktop cooling and a power supply with headroom are part of the specification, not accessories.
How should the pipeline be structured before the first download?
Decide the output grid, projection, and resolution before pulling any scene. Reprojecting after the fact multiplies work and introduces resampling error that is hard to trace later. Keep a manifest of every scene with its acquisition date, cloud cover, and licence, because a map published two years later will need that record.
Version the processing chain. A classification run that cannot be reproduced from the raw archive is a result that cannot be defended, and the difference between a defensible map and an anecdote is usually a script and a manifest. Test the chain on one tile before scaling to a hundred; most pipeline errors are cheaper to find at that size.
Finally, separate what the imagery proves from what it suggests. A change detection result shows that reflectance changed between two dates; attributing that change to deforestation, flooding, or construction requires ground evidence. That distinction is the same one that separates a stress test from a stability claim, and it holds whether the subject is a processor or a river delta.
How should the pipeline be structured before the first download?
- Decide the output grid, projection, and resolution before pulling any scene.
- Keep a manifest of every scene with its acquisition date, cloud cover, and licence.
- Version the processing chain, because a classification run that cannot be reproduced from the raw archive is a result that cannot be defended.
- Test the chain on one tile before scaling to a hundred.
- Store the raw archive separately from derived products so a reprocessing run does not mean re-downloading.
Where this goes wrong
Cloud cover is the fourth parameter and the one that ruins schedules. Over the Maritime Continent, a usable optical scene may appear only a handful of times per year, which is why radar and optical are usually combined rather than chosen between.
A mosaic that runs for six hours will push a laptop into thermal throttling within the first hour, and the resulting slowdown is easy to mistake for a software problem.
A change detection result shows that reflectance changed between two dates; attributing that change to deforestation, flooding, or construction requires ground evidence.
Source read for this page: USGS EarthExplorer.